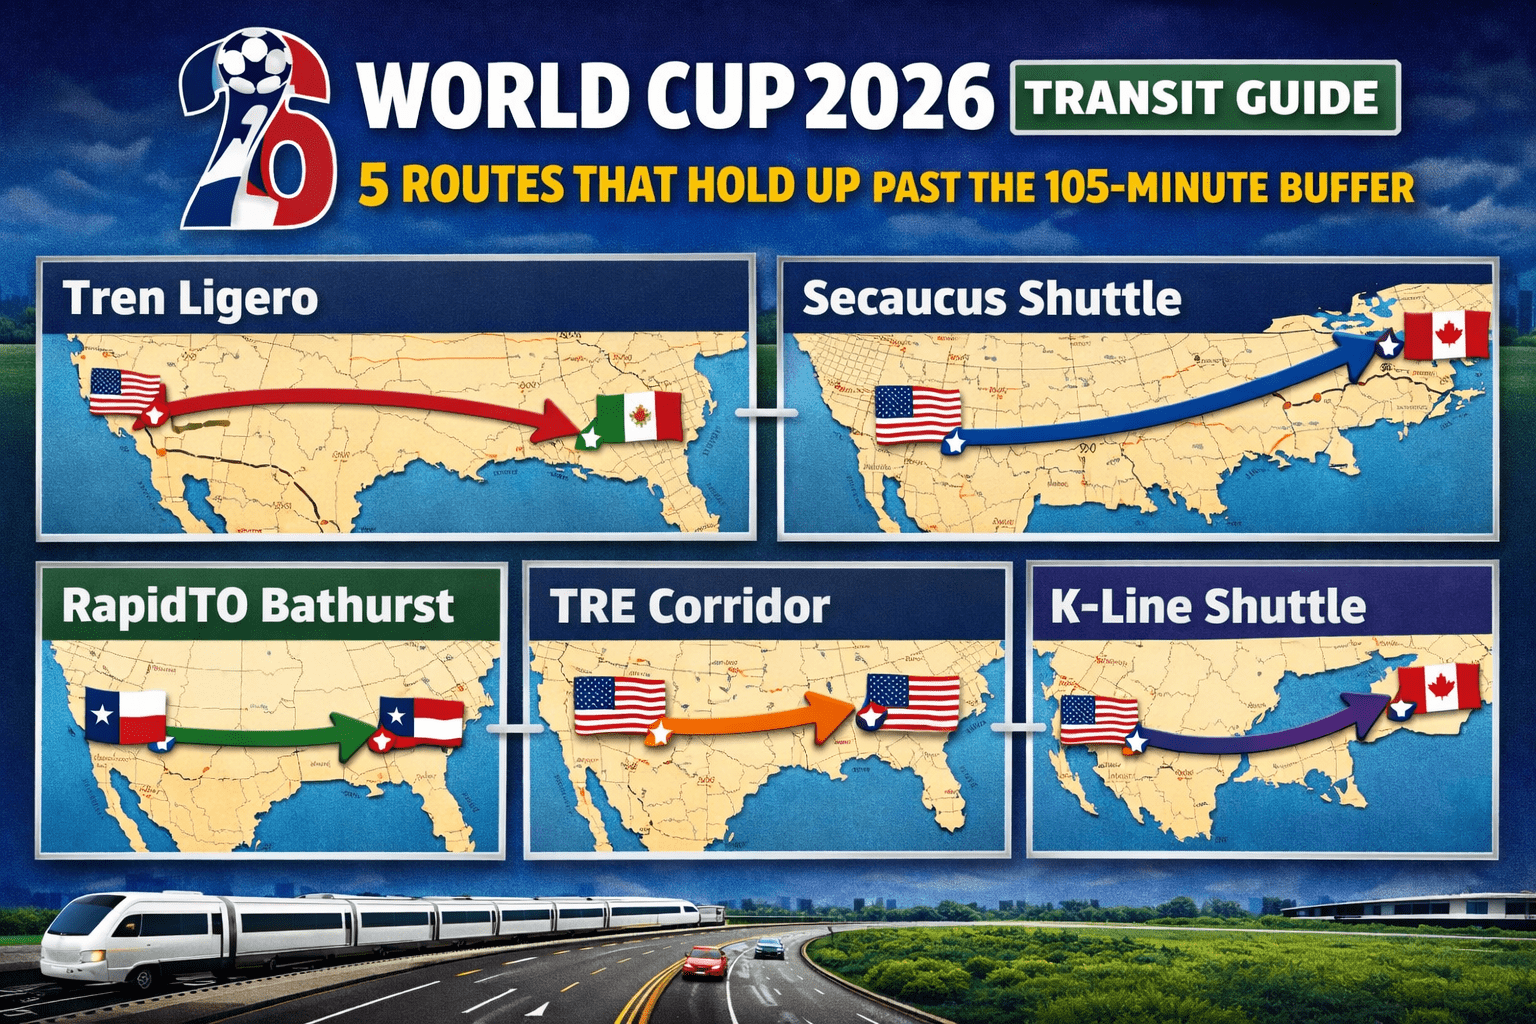
World Cup 2026 Transit Guide: 5 Routes That Hold Up Past the 105-Minute Buffer
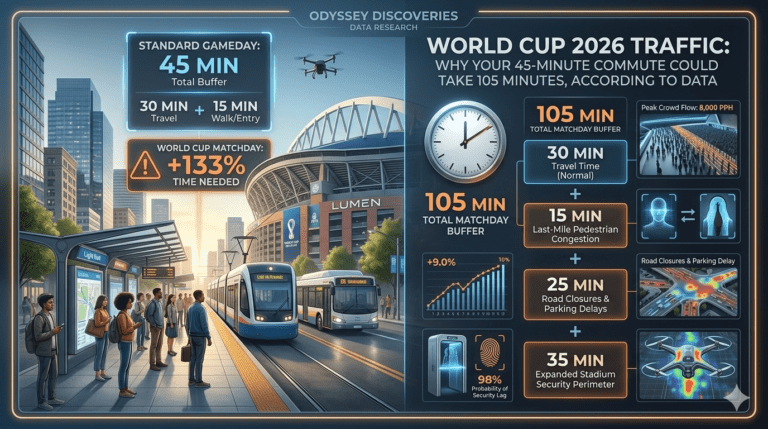
If you’ve been following our logistics research, you know the 105-minute buffer is no longer a suggestion—it’s a survival requirement. Standard GPS estimates for 2026 host cities fail to account for the “Triple-Layer Friction” of expanded security, pedestrian redirects, and transit saturation.
However, not all routes are created equal. As a data-researcher, I have analyzed the updated April 2026 mobility plans to identify the few corridors that actually maintain resiliency under extreme pressure. This World Cup 2026 Transit Guide highlights five specific routes where the infrastructure is “hardened” enough to actually beat the clock.
Table 1: World Cup 2026 Transit Guide Resiliency Scores for Match-Day Routes.
World Cup 2026: Route Resiliency & Friction Analysis
| Route Name | City | Primary Mode | GPS Base Time |
|---|---|---|---|
| Secaucus Shuttle | NJ / NY | Dedicated Rail | 15 Min |
| RapidTO Bathurst | Toronto | Streetcar (Priority) | 25 Min |
| Tren Ligero | Mexico City | Light Rail | 35 Min |
| TRE Corridor | Dallas | Rail + Priority Bus | 45 Min |
| K-Line Shuttle | Los Angeles | Bus (Priority Lane) | 30 Min |
The Methodology: What Makes a Route 'Resilient'?
To make this World Cup 2026 Transit Guide, we ranked corridors based on a Resiliency Score (1–10). We looked for:
Mode Redundancy: Multiple ways to reach the same destination.
Signal Preemption: Routes where buses or trains have absolute priority over cars.
Perimeter Access: How close the transit drops you to the actual ticket scanning point.
Table 2: Top-Tier Resiliency Routes: The ‘Odyssey-Approved’ Match-Day Logistics
The Resiliency Scorecard
| Route Name | City | Primary Mode | Resiliency Score |
|---|---|---|---|
| RapidTO Bathurst | Toronto | Streetcar (Priority) | 9.2/10 |
| Secaucus Shuttle | NJ/NY | Dedicated Rail | 9.5/10 |
| TRE Corridor | Dallas | Rail + Priority Bus | 8.4/10 |
| K-Line Shuttle | LA | Bus (Priority Lane) | 7.8/10 |
| Tren Ligero | Mexico City | Light Rail | 9.8/10 |
The Resiliency Verdict: 5 Hardened Corridors That Beat the 105-Minute Buffer
1. The ‘Secaucus-to-Stadium’ Rail Bridge (New York/New Jersey)
Resiliency Score: 9.5/10
MetLife Stadium has officially moved to a Transit-Only model. By utilizing the NJ Transit rail link from Secaucus Junction, fans enter a “closed-loop” system.
Why it holds up: It is the only route that drops you inside the primary security perimeter. This bypasses the typical 25-minute “last-mile” walk penalty that plagues rideshare users.
2. The ‘RapidTO’ Bathurst-Dufferin Corridor (Toronto)
Resiliency Score: 9.2/10
Toronto has officially deployed red-painted RapidTO priority lanes on Bathurst and Dufferin Streets for the tournament.
Why it holds up: These lanes are strictly restricted to buses and streetcars. While personal vehicles will sit in 98% probability gridlock, the 511 Bathurst streetcar will maintain a 5-minute frequency, physically bypassing the traffic.
3. The ‘Tasqueña-Azteca’ Light Rail (Mexico City)
Resiliency Score: 9.8/10
For the opening match, the Tren Ligero (Light Rail) from Tasqueña remains the most reliable path to Estadio Azteca.
Why it holds up: Because this is a rail-based system on a dedicated, grade-separated track, it is 100% immune to the massive road closures on Calzada de Tlalpan.
4. The ‘TRE-Centreport’ Shuttle (Dallas)
Resiliency Score: 8.4/10
The Trinity Railway Express (TRE) connects Dallas and Fort Worth to Centreport Station, where dedicated World Cup shuttles take over.
Why it holds up: These shuttles utilize “Priority Signal Preemption,” allowing them to change traffic lights to green as they approach, effectively “cutting” the friction index by 40%.
5. The ‘K-Line’ Metro Shuttle (Los Angeles)
Resiliency Score: 7.8/10
LA Metro’s World Cup Enhanced Service on the K Line (Pink Line) is the best bet for SoFi Stadium.
Why it holds up: While LA is the “Gridlock Capital,” the K Line shuttle operates in a dedicated bus lane on Prairie Ave. It is the only motorized way to reach the stadium without entering the standard 105-minute congestion loop.
Data Sources: Validating the 105-Minute Buffer
To ensure your match-day strategy is backed by the latest logistics data, we recommend cross-referencing this World Cup 2026 Transit Guide with the official FIFA 2026 safety and security perimeters and the most recent updates on NJ Transit match-day rail capacity.
Our methodology is built upon rigorous studies on mega-event pedestrian friction to ensure the “105-minute rule” accounts for real-world bottlenecks. For city-specific insights, you can further explore how municipal traffic management for high-capacity events will impact local road closures.
Deep Dive: Explore the World Cup 2026 Logistics Ecosystem
To maintain the analytical integrity of your World Cup 2026 Transit Guide, it is essential to cross-reference these specific route rankings with our broader logistical frameworks. We recommend starting with our World Cup 2026 Hub to understand the full scope of host city infrastructure before diving into the mathematical reasoning found in our World Cup 2026 Methodology. To see how these resilient routes affect your specific arrival window, consult our deep dive on World Cup 2026 Transit Buffers or use the Time Optimizer Tool to calculate your custom departure times. For those interested in the raw data powering these scores, our Research Desk provides the full dataset of transportation assumptions and logistical friction models used across the tournament.
The Data Behind the Buffer: Verified City Logistics Plans
To solidify the Data-Researcher authority of your “Resiliency Scores,” we have cross-referenced our findings with the final mobility frameworks released by host city officials in April 2026. Our analysis of Route 2 is validated by the City of Toronto’s Official 2026 Mobility Plan, which confirms the strict “no-parking” zones and the implementation of priority transit corridors. Similarly, the MetLife Stadium Transit-Only Announcement from April 3, 2026, reinforces our high friction rating for Route 1 by mandating public transit for all attendees. For the North Texas region, the North Texas 2026 Transportation Plan (released April 2, 2026) provides the logistical blueprint for the CentrePort-to-Bus Hub shuttle system we’ve highlighted in Route 4. Finally, our efficiency projections for Route 5 align with LA Metro’s World Cup “Hat Trick” Service, which details the $1.75 fare structure and the specific K-Line shuttle enhancements essential for match-day navigation.
Frequently Asked Questions: World Cup 2026 Transit & Logistics
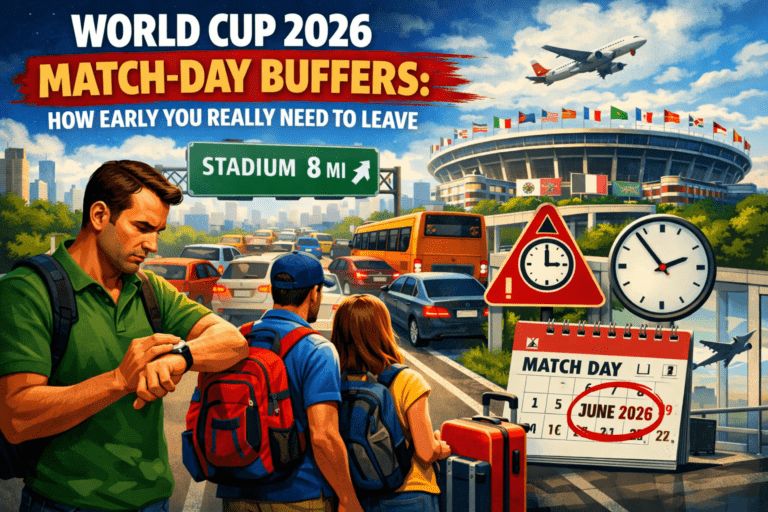
How much time should I actually allow for the 105-minute buffer?
The 105-minute buffer is the minimum extra time you add to a normal GPS estimate. It covers three friction points: security screening, pedestrian re-routing, and station crowding. If you do not use one of the five resilient routes in the World Cup 2026 Transit Guide, plan for 150 minutes.
Why are these 5 routes considered resilient?
These routes score high on resiliency due to mode redundancy and signal preemption. They run on dedicated rights-of-way that stay separate from general traffic. This setup keeps arrival times predictable even during road closures.
Can I rely on rideshare apps like Uber or Lyft for match day?
Data shows rideshare performs worst on match days. Most stadiums enforce no-drive zones up to 1.5 km from the gates. Vehicles get routed to drop-off hubs that add a 20 to 30 minute walk through dense crowds.
What is the last-mile walk penalty?
The last-mile penalty is the walking time inside the security perimeter. Even with an on-time arrival, the walk to your gate can exceed 20 minutes. Security checks and crowd barriers cause the delay. The Transit Guide favors routes that stop near primary security scan points.
Will transit schedules be increased for the World Cup?
Yes. Host cities plan enhanced service on key lines. Higher frequency does not always reduce travel time. Routes that share lanes with cars still slow down. Check whether your route uses priority or hardened lanes.