Research Desk: Travel Carbon & Transport Methodology
Content on the Research Desk is updated regularly as new data or methodological refinements occur.
The Research Desk is the methodological and documentation layer behind all analysis published on Odyssey Discoveries.
It explains where data comes from, how assumptions are selected and applied, and how analytical frameworks are used consistently across studies. The Research Desk exists to ensure transparency, reproducibility, and interpretive clarity across transport comparisons, carbon estimates, cost analysis, and sustainability research focused on Spain and Portugal.
What Is the Research Desk?
The Research Desk is the infrastructure layer behind all analysis published on Odyssey Discoveries.
Rather than presenting rankings or recommendations, it documents:
Where data comes from
How assumptions are chosen and applied
How figures are normalized for fair comparison
How updates are handled when datasets or methods change
This approach follows research best practices by explaining why decisions are made, not just what results appear.
How to Use the Research Desk
Use articles to understand what the results mean
Use Methodology & Assumptions to understand how interpretations are framed
Use Transport Methodology & Data to understand how figures are calculated
Trace any number in an article back to its documented source and assumptions
If a figure appears in an Odyssey Discoveries article, the data source, assumptions, and calculation logic are documented within the Research Desk.
Analytical Governance
To maintain consistency across articles and datasets, Odyssey Discoveries separates global assumptions from applied analysis:
Methodology & Assumptions defines the shared interpretive rules used across all research, including city boundary definitions, population baselines, comparative logic, and certification interpretation.
→ This page establishes the analytical standards that apply unless explicitly stated otherwise.Transport Methodology & Data documents the mode-specific calculation frameworks used for transport cost, carbon, and door-to-door time analysis.
Individual articles apply these frameworks to specific routes, cities, or scenarios. Where deviations or exceptions occur, they are documented explicitly at the dataset or article level.
Transport Research Hub
All transport comparisons published on Odyssey Discoveries apply the shared methodology and assumptions documented on this page. The following analyses use this framework to compare travel time, cost, and carbon emissions across specific routes and regions.
Iberian Route Comparisons
Madrid–Barcelona train vs flight carbon comparison
Lisbon–Porto transport time, cost, and emissions analysis
Lisbon–Seville cross-border transport benchmark
Porto–Santiago de Compostela route comparison
Cross-Route & Index-Based Analysis
Iberian Transport Comparison: A Data-Driven Face-Off of 5 Key Travel Routes
The Iberian Transport Sustainability Score
Transport-related comparisons are governed by a dedicated Transport Methodology and Data framework, which documents how travel time, cost, and carbon emissions are calculated across modes.
Transport Methodology Overview by Mode
Transport analyses published on Odyssey Discoveries apply mode-specific calculation rules documented in the Transport Methodology and Data framework. For transparency, the Research Desk identifies how each transport mode is governed.
Train Travel Carbon Methodology
Governed by standardized rail emission factors and occupancy assumptions
Full methodology documented in the Transport Methodology and Data page
Flight Carbon Methodology
Applies short- and medium-haul logic and airport access assumptions
Radiative forcing treatment is documented in the transport methodology framework
Bus & Coach Transport Methodology
Uses per-passenger emission factors normalized for occupancy
Car Travel Assumptions (Solo vs Shared)
Differentiates between single-occupancy and shared travel baselines
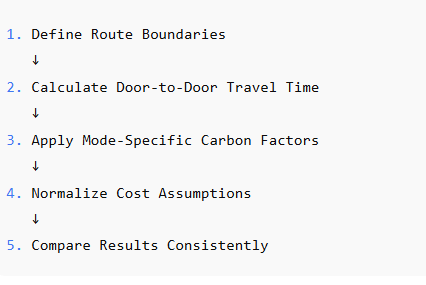
How Transport Comparisons Are Built
1. Define Route Boundaries
Routes are defined using consistent city and metropolitan boundaries to ensure that comparisons reflect real travel behavior, not idealized point-to-point distances.
2. Calculate Door-to-Door Travel Time
Travel time includes:
Access to departure point
Waiting and transfer time
In-vehicle travel
Arrival and egress
This avoids misleading comparisons based solely on scheduled journey time.
3. Apply Mode-Specific Carbon Factors
Carbon estimates are calculated using mode-specific emission factors documented in the Transport Methodology and Data framework, ensuring consistent treatment of trains, buses, cars, and flights.
4. Normalize Cost Assumptions
Costs are normalized using comparable fare assumptions and typical booking conditions, avoiding distortions caused by promotional or outlier pricing.
5. Compare Results Consistently
All results are presented using the same assumptions, boundaries, and metrics so that differences reflect transport characteristics, not methodological inconsistencies.
Travel Carbon & Transport Methodology Explained
All route comparisons published on Odyssey Discoveries are based on a shared analytical framework designed to ensure consistency across time, modes, and cities.
Key methodological principles include:
Door-to-door travel logic, not scheduled departure times
Mode-specific carbon intensity factors, sourced from public institutions
Consistent occupancy assumptions for cars, trains, buses, and flights
Comparable boundary definitions for cities and metro areas
Carbon estimates represent CO₂-equivalent emissions per passenger, based on documented assumptions and publicly available datasets.
Data Sources Used in Travel & Transport Analysis
The Research Desk relies exclusively on institutional, publicly accessible data sources, including but not limited to:
National and regional transport authorities
European environmental and statistical agencies
Certified sustainability programs (e.g. Green Key)
Railway, aviation, and bus network publications
Urban population and boundary datasets
Each dataset is evaluated for scope, reliability, update frequency, and methodological limitations before inclusion.
Methodology & Assumptions
This section documents the global analytical rules applied across all studies, including:
How “door-to-door time” is defined and calculated
How waiting, transfers, and access time are incorporated
How cost ranges are selected and normalized
How carbon factors are applied consistently across routes
When assumptions differ by mode or geography, those differences are explicitly documented to prevent misleading comparisons.
Transport Methodology & Shared Frameworks
A shared transport methodology ensures that comparisons between trains, buses, cars, and flights remain internally consistent.
This includes:
Standardized distance calculations
Mode-specific emission factors
Consistent passenger assumptions
Comparable treatment of access and transfer times
This framework allows readers to trace any published figure back to its analytical logic.
City-Level Travel & Sustainability Datasets
The Research Desk maintains city-level datasets used in comparative analysis:
Lisbon — Green Key Certification Dataset
Porto — Green Key Certification Dataset
Madrid — Green Key Certification Dataset
Barcelona — Green Key Certification Dataset
Each dataset documents:
Boundary definitions
Population baselines
Certification scope
Data limitations and update logic
These datasets support sustainability comparisons without relying on rankings, sponsorships, or affiliate incentives.
Indices & Analytical Frameworks
Some analyses rely on reusable indices and scoring frameworks developed for comparative clarity.
These frameworks:
Apply the same weighting logic across studies
Are documented for transparency
Are updated when underlying assumptions change
Indices are intended as analytical tools, not consumer scores.
Research Desk — Reference & Methodology
https://odysseydiscoveries.
Why Methodology Transparency Matters in Travel Research
Travel carbon estimates, journey times, and cost comparisons often vary widely online due to undisclosed assumptions or inconsistent methodologies.
By documenting data sources and analytical logic openly, the Research Desk enables:
Informed interpretation of results
Fair comparisons across transport modes
Independent verification of published figures
Transparency is essential for credible sustainability analysis.
What the Research Desk Includes
Documented data sources referenced in published articles
Global assumptions and methodological standards
Mode-specific transport calculation frameworks
City-level datasets used for comparative analysis
Reusable indices and analytical models
What the Research Desk Does Not Include
To protect analytical clarity and independence, the Research Desk does not include:
Hotel rankings or recommendations
Booking or affiliate content
Sponsored datasets or proprietary feeds
Experiential travel narratives
Real-time dashboards or live pricing tools
The Research Desk supports verification and interpretation, not casual browsing or trip planning.
Update & Integrity
Content on the Research Desk is updated when:
New datasets become available
Methodological refinements are introduced
Existing assumptions require revision
- Material changes to assumptions or calculation logic are documented before being applied to published analyses.
Updates prioritize consistency and traceability, ensuring older analyses remain interpretable over time.
Institutional Data Sources & Authoritative Frameworks
This research and the transport analyses published on Odyssey Discoveries are grounded in publicly available, official datasets and methodological guidance from leading statistical and environmental agencies:
Institutional Data Sources & Authoritative Frameworks
European Environment Agency (EEA) – Transport Greenhouse Gas Emissions
Provides official European data on greenhouse gas emissions from all transport modes, informing carbon estimates used in cross-country route comparisons.
Link
Eurostat Transport and Energy Databases
Offers EU-wide statistics on transport energy consumption, emissions, and modal distribution, supporting normalized cost and carbon calculations.
Link
Instituto Nacional de Estadística (INE — Spain) – Transport Statistics
Spain’s official statistical office providing passenger and freight transport data by mode and distance, forming the basis of Spanish route-level analysis.
Link
Statistics Portugal (INE Portugal) – Transport and Communications
Portugal’s national statistics authority, delivering official datasets on passenger mobility and modal splits used in Portuguese route comparisons.
Link
RENFE (Spain) & Comboios de Portugal (CP)
National rail operator reports provide ridership and operational data that underpin rail route calculations and carbon estimates.
Link
Green Key Sustainable Tourism Certification
Official eco-label program documenting certified sustainable cities and properties, used to support city-level sustainability datasets.
Link
The following analyses apply the transport and carbon methodology documented above:
Door-to-door travel time assumptions (Coming soon)
How flight carbon emissions are calculated (Coming soon)
- Transport methodology & data framework
- Iberian transport comparison across key routes
- Iberian transport sustainability score methodology
- Lisbon – Seville sustainable transport comparison
- Travel Carbon Calculator Hub
- Madrid – Barcelona train vs flight carbon comparison
🚆 ✈️ Travel Decision Tool
Answer a few questions to find your best travel option
1 Is there a direct train under 2.5 hours?
2 Do I need to work or want to relax?
3 Am I going to islands or northern Spain?
4 Booking last minute on a budget?
5 Carrying lots of luggage?
🚆 RECOMMENDATION: Take the TRAIN
Based on your answers, the train is your best option!
- Flights are often banned for short distances
- Better for work or relaxation
- Train stations are easier with luggage
✈️ RECOMMENDATION: FLY without second-guessing
Based on your destination, flying is the clear choice!
- Islands and northern Spain are better reached by air
- Often faster for remote destinations
🔍 RECOMMENDATION: Check BOTH options
For last-minute budget bookings, compare train and flight prices.
- Check budget airlines for last-minute sales
- Compare with train ticket prices
- Sometimes flight sales beat last-minute train prices
🤔 RECOMMENDATION: Consider both options
Compare train and flight options based on these factors:
- Environmental impact (train is greener)
- Total door-to-door travel time
- Current prices for both options
- Personal preference for comfort
📋 Quick Decision Guide
🚆 TRAIN when:
- Direct train < 2.5 hours
- Need to work/relax
- Carrying lots of luggage
- Want less stress
✈️ FLY when:
- Going to islands/northern Spain
- Long distances
- Time is critical
🔍 CHECK BOTH when:
- Booking last minute on budget
- Prices are fluctuating
- Flexible on timing