The Iberian Transport Sustainability Score: A Data-Driven Method to Compare Cost, Carbon and Time Across Portugal and Spain
Choosing between a train, bus, or flight for your journey across Spain and Portugal is more complex than checking a timetable. You’re weighing a stack of competing priorities: your budget, your schedule, and the silent cost of your carbon footprint. Standard booking sites present these factors in isolation, a price here, a duration there, leaving you to do the mental math. The result? Decision fatigue, and often, a choice that doesn’t truly align with your values.
That’s why we built something different. Welcome to the Iberian Transport Sustainability Score. It’s not just another calculator; it’s a unified, transparent method designed specifically for the Iberian Peninsula. For any route from Porto to Seville or Madrid to Lisbon, this Iberian Transport Sustainability Score gives you a single, comparable metric that balances what matters: your money, your time, and your impact on the landscapes you’ve come to explore.
This article pulls back the curtain. I’ll walk you through the exact data sources we trust, the mathematical formula that powers the score, and how a simple slider can reveal the best transport option for your specific priorities. Let’s dive into the methodology that turns overwhelming data into a clear travel decision.
Why Compare Cost, Carbon AND Time? The Iberian Trilemma
Travel in Iberia presents a unique puzzle. The region’s transport network is a patchwork of high-speed AVE trains in Spain, the slower but scenic Alvia and Intercidades services, a dense web of private and public bus companies, and competitive discount airlines. A choice that seems obvious on one route becomes a dilemma on another.
If you only minimize cost, you might end up on a 12-hour overnight bus, sacrificing a day of your trip. If you only minimize carbon, you could choose a train route with three confusing connections. If you only minimize time, you’ll likely fly, generating up to 10 times the emissions of ground transport.
This is the Iberian Travel Trilemma. You can’t optimize for all three corners of the triangle at once. The fastest option pollutes the most. The greenest can be slow. The cheapest often lacks flexibility.
Our Iberian Transport Sustainability Score exists to solve this trilemma. Instead of presenting you with a winner we’ve pre-determined, we give you a tool to find your winner. It quantifies the trade-offs, so you can make an informed choice that reflects your personal balance of budget, conscience, and itinerary. It’s a recognition that a time-pressed business traveler and a budget-conscious backpacker both deserve sustainable options—they just look different.
Pillar 1: Sourcing Accurate, Iberia-Specific Data
A model is only as good as the data fed into it. For a score to be trustworthy, every input must be rigorously sourced and regionally appropriate. We don’t use global averages here. What follows is a breakdown of where our numbers come from and why we chose these sources for Iberia.
Carbon Intelligence: Getting Iberia’s CO₂ Right
Not all carbon calculations are created equal. A generic “grams per passenger kilometer” figure fails to account for a critical Iberian reality: Portugal’s national grid runs on over 60% renewable energy, while Spain’s mix includes more natural gas and coal. A train powered by Portuguese wind has a different impact than one running on Spanish fossil fuels.
For trains, cars, and flights, we use the EcoPassenger calculation engine. Developed by the respected Institut für Energie- und Umweltforschung (IFEU), EcoPassenger uses specific, current data on energy generation for each country and the exact type of train or aircraft on a route. When we tell you a Lisbon to Seville train emits 15.5 kg of CO₂, that’s not an estimate—it’s a calculation factoring in Portugal’s renewable-heavy electricity.
For buses, the standard is different. We rely on the latest well-to-wheel emission factors published by the European Environment Agency (EEA). These factors account for real-world conditions like average passenger load (which is high on Iberian intercity coaches) and fuel type. This gives us a robust, realistic figure of approximately 27 grams of CO₂ per passenger kilometer for a modern coach.
This two-source approach ensures we’re using the most precise tool for each mode. It’s a level of detail you won’t find on a standard booking site, and it’s foundational to a credible Iberian Transport Sustainability Score.
Cost Realism: Beyond the Advertised Fare
The price you see in a search isn’t always the price you pay. Our cost data builds in the hidden expenses of Iberian travel:
Seat Reservations: On most Spanish long-distance trains (AVE, Alvia), a reservation is mandatory and included. On some cross-border and Portuguese services, it’s an extra few euros that can be missed at a glance.
Baggage Fees: That tempting €19 bus fare might assume one small carry-on. Adding a suitcase can sometimes double the cost, especially on discount operators.
The “Last Mile”: We focus on the door-to-door journey. A flight might be €50, but if it lands at a remote airport requiring a €25 taxi or bus into the city, that’s part of the true cost.
We gather our pricing from a combination of live API data from major aggregators and direct operator sites, checking historical trends to ensure our projections for future travel (like our December 2025 examples) are realistic, not just optimistic.
Time Calculation: The Door-to-Door Reality
“Travel time: 1 hour.” For a flight, that’s a fantasy. It ignores the 90-minute pre-flight airport arrival, security lines, boarding, deplaning, and the journey from the often-distant airport to your final destination.
Our time metric is total door-to-door time. For a train, we include time to the central station and a buffer for transfers. For a flight, we add a standard 2.5 hours for airport procedures. For a bus, we factor in that stations are usually central, but services can be subject to traffic.
This honest approach often reshuffles the leaderboard. A 1-hour flight can easily become a 4.5-hour ordeal, while a direct 7-hour bus becomes a simple 7.5-hour door-to-door journey. Comparing true time, not marketed time, is the only way to make a fair decision within our Iberian Transport Sustainability Score.
Pillar 2: The Core Algorithm – How the Score is Built
With accurate data in hand, the next challenge is comparison. How do you judge €19 against 20 kg of CO₂ against 7 hours of your time? You normalize them.
Step 1: Normalization – Creating a Common Language
We convert all our raw data, euros, kilograms, and hours, onto a common 0-10 scale. A score of 10 represents the best performance on that metric (lowest cost, lowest carbon, shortest time), and 0 represents the worst.
The formula is straightforward but powerful:
Normalized Score = (Max Value – Your Value) / (Max Value – Min Value) × 10
Let’s use the Lisbon-Seville cost data as an example:
Max (Worst) Cost: €100 (Flight)
Min (Best) Cost: €19 (Bus)
Train Cost: €59
Train Cost Score = (100 – 59) / (100 – 19) × 10 = (41 / 81) × 10 = 5.1
This means the train’s cost scores a 5.1 out of 10. The bus, at €19, scores a perfect 10. The flight, at €100, scores a 0. We repeat this process for CO₂ emissions and for time. Now, all three utterly different units of measurement can be spoken about in the same terms.
Step 2: Dynamic Weighting – Your Priorities, Your Score
This is where our method becomes personal. Not everyone values cost, carbon, and time equally. You tell us what’s important to you using three simple sliders:
Cost Weight: How important is budget to you?
CO₂ Weight: How important is minimizing your carbon footprint?
Time Weight: How important is a short travel time?
You allocate 100% of importance across these three factors. Are you a climate-conscious traveler? Maybe you set CO₂ to 70%, Cost to 20%, and Time to 10%. Are you optimizing a tight itinerary? Flip it: Time 70%, Cost 20%, CO₂ 10%.
There is no “correct” weighting. This is the essence of a data-driven method to compare. It removes our bias and empowers your values. It’s the interactive heart of the Iberian Transport Sustainability Score.
Step 3: The Total Score – Your Personal Verdict
The final calculation brings it all together. For each transport option, we take its three normalized scores and multiply them by your personal weights, then sum the results.
Total Score = (Cost Score × Cost Weight) + (CO₂ Score × CO₂ Weight) + (Time Score × Time Weight)
The option with the highest total score is the one that best matches your unique profile. It’s not necessarily the cheapest, or the greenest, or the fastest, it’s the optimal balance of all three, as you define it. This final number is your actionable Iberian Transport Sustainability Score for that option.
A score above 8 indicates an excellent match. A score between 6 and 8 is a good fit with some compromise. Below 6, and that option requires you to sacrifice significantly on what you said was important.
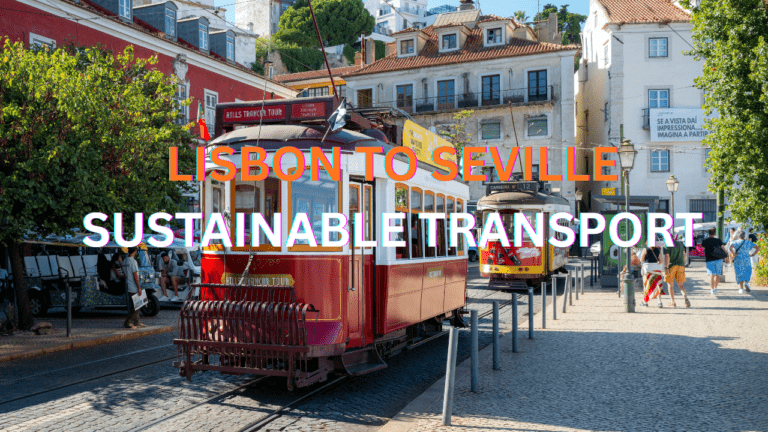
Pillar 3: The Method in Action – A Lisbon to Seville Case Study
Let’s see how this works with real numbers. Below is our interactive calculator for a Lisbon to Seville trip. Try the scenarios that follow to see the Iberian Transport Sustainability Score in action.
Try These Scenarios:
The Sustainable Traveler (CO₂: 70%, Cost: 20%, Time: 10%): With emissions heavily weighted, the train (lowest CO₂) will likely take the top spot, despite its higher cost and longer journey. The flight will sink to the bottom.
The Budget Explorer (Cost: 70%, CO₂: 20%, Time: 10%): Here, the bus shines. Its rock-bottom €19 fare, combined with respectable emissions, makes it the undisputed value champion. The train and flight, with their higher costs, fall behind.
The Time-Optimizer (Time: 70%, Cost: 20%, CO₂: 10%): Speed is king. The flight will win, but look at its total score. Even when winning, its high cost and massive carbon footprint drag its score down, revealing it as a choice of pure convenience with heavy trade-offs.
What the Scores Tell You: The winner changes because the definition of “best” changes. A low score for the flight in the first scenario isn’t a judgment, it’s data. It clearly says, “This option conflicts with your stated goal of low emissions.” That’s the power of a transparent Iberian Transport Sustainability Score.
To see how this Lisbon–Seville route fits into the bigger picture of responsible travel, explore our in-depth guide: [Lisbon to Seville: The Most Sustainable Transport Options Compared] a data-backed breakdown of emissions, cost, and travel time to help you make a smarter, lower-impact journey across Iberia. READ HERE
🚂 Sustainable Transport Calculator
Lisbon → Seville | Sample Date: December 19, 2025
Adjust the sliders based on your personal priorities to find your best option
🎯 Set Your Priorities
Drag the sliders to allocate 100% importance across the three factors
📊 Your Results
📋 Recommendation
Data based on sample date December 19, 2025. Actual prices and schedules may vary.
CO₂ estimates from EcoPassenger and EEA. Door-to-door time includes transfers and waiting.
Applying the Method: From One Route to the Entire Peninsula
The Lisbon-Seville corridor is just the beginning. This same, consistent methodology is applied to every route analysis we publish. It allows for true apples-to-apples comparisons across the entire region.
We’re currently running the numbers on other key Iberian corridors, and the early insights are fascinating:
Madrid to Barcelona: This is where high-speed rail truly dominates. Preliminary scores show the AVE train frequently winning on all three metrics, it’s competitive on price, significantly lower in carbon, and door-to-door time is often faster than flying when you factor in airport travel.
Porto to Lisbon: A clear-cut victory for the train. The Alfa Pendular or Intercidades service is direct, affordable, fast (under 3 hours), and low-carbon, making it nearly impossible for buses or planes to compete on the score.
Seville to Granada: Here, geography dictates a different story. The lack of a direct rail line gives the modern coach services a major advantage in time and cost, making the bus the frequent score winner for most traveler profiles.
By using one standardized method, we’re building a comparable map of sustainable travel intelligence across Portugal and Spain. You’ll soon be able to see not just which option is best for your trip from Málaga to Córdoba, but how that corridor’s sustainability profile compares to the one from Valencia to Madrid.
Internal Link Suggestion 1: For a practical application of this score, see our detailed guide: [Sustainable Transport from Lisbon to Seville: A Calculated Choice].
Frequently Asked Questions About the Score
How is this different from a simple carbon calculator?
A carbon calculator gives you a single, isolated data point, your emissions. Our Iberian Transport Sustainability Score is a decision-making framework. It integrates that carbon number with cost and time, and lets you assign your own importance to each. It answers the question, “Given that this flight emits 120kg of CO₂, is its time savings worth it to me, and can I afford it?”
Can I use this method for travel outside Portugal and Spain?
The algorithmic framework normalization and weighting is universally sound. However, the accuracy of the Iberian Transport Sustainability Score depends entirely on our curated, region-specific data sets. The emission factors for Spanish grid electricity, the pricing models of RENFE and CP, the door-to-door time estimates for Iberian cities; these are what make it precise. Applying the same formula with generic data would produce a generic, less reliable result.
How often is the underlying data updated?
We are committed to accuracy. Emission factors from EcoPassenger and the EEA are reviewed and updated quarterly. Pricing algorithms and schedule data are checked monthly to reflect seasonal changes and new routes. The travel landscape shifts, and our score shifts with it to remain the most reliable comparison tool for Iberia.
Conclusion: Smarter Travel Decisions, One Score at a Time
The goal of the Iberian Transport Sustainability Score isn’t to tell you what to do. It’s to end the guesswork. It replaces the nagging feeling of “I think the train is probably better” with a clear, data-backed insight: “For my budget and my desire to cut emissions, the bus scores 8.7, the train scores 7.1, and the flight scores 2.5.”
This method transforms you from a passive consumer of travel options into an informed decision-maker. Every time you use this Iberian Transport Sustainability Score, you’re voting for a travel industry that is more transparent and accountable. You’re supporting the infrastructure, the rail lines, the modern coach services that makes low-impact exploration of Iberia possible.
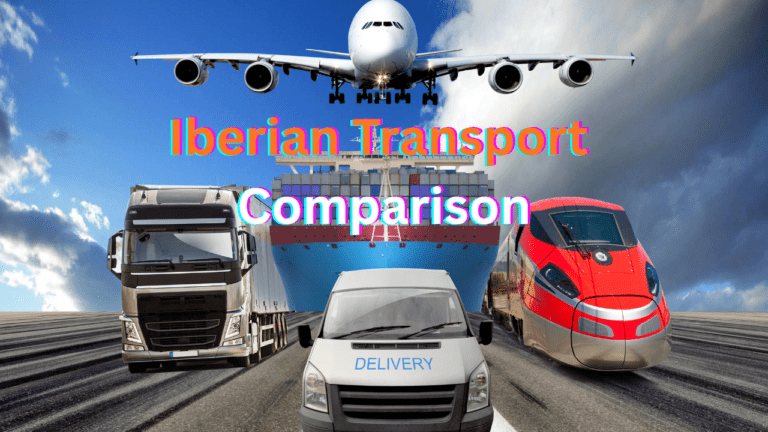
To explore how transport choices fit into the bigger picture of sustainable travel, dive into our pillar guide: [Iberian Transport Comparison: Trains, Buses & Flights Compared] a data-driven breakdown to help you choose the smartest, lowest-impact way to travel across Spain and Portugal. READ HERE
Put the score to work. Start with our most detailed analysis yet: [Sustainable Transport from Lisbon to Seville: A Calculated Choice], where every number in this article comes to life.
And tell us, which Iberian journey keeps you up at night, weighing the options? Which route should we analyze next? Let us know in the comments below your next trip could be the focus of our next deep dive.
Methodology Note: This article reflects our scoring algorithm as of Spring 2025. We continuously refine our models with new data. All calculations are intended for personal travel planning guidance. Specific prices and schedules are always subject to change with operators.